
Five numbers tell you almost everything about a video ad: hook rate, hold rate, click through rate, cost per add to cart and CPA. Read them in that order and each one tells you which part of the ad broke.
The order is the whole point. Every metric here corresponds to a specific moment in the ad, and reading them in sequence turns a vague "it did not work" into a specific instruction for the next edit.
1. Hook rate
What it is: three second video plays divided by impressions.
What it tells you: whether the opening frame and first line earned attention.
This is the fastest signal you have. It accumulates in hours rather than days, which makes it the only metric that lets you kill an ad before it has spent real money.
A low hook rate is almost never a targeting problem. The ad was served to people, they saw it, and they kept scrolling. That is a creative verdict delivered in about four hours.
2. Hold rate
What it is: the percentage still watching at your chosen marker, usually 15 seconds or 50 percent of length. Pick one and use it consistently, because the two are not comparable.
What it tells you: whether the ad kept the promise the hook made.
Hook rate high, hold rate low, is the most common failure pattern in performance video and it is always the same diagnosis. The opening wrote a cheque the next ten seconds did not cash. People arrived expecting one thing and got another.
The fix is rarely a better hook. It is usually moving the payoff earlier, or changing the hook so it promises what the ad actually delivers. We went through the whole diagnosis in why your hook dies at three seconds.
3. Click through rate
What it is: link clicks divided by impressions. Use link CTR, not all clicks, because all clicks includes people expanding the caption.
What it tells you: whether the ad created enough desire to act.
Good hold rate with poor CTR means the ad was watchable but not persuasive. People enjoyed it and felt no reason to move. That is usually a missing or weak offer, or a CTA that arrives after everyone has already gone.
This is the most common failure in ads that look excellent. Entertaining is not the same as convincing, and the metric separating those two is this one.
4. Cost per add to cart
What it is: spend divided by add to cart events.
What it tells you: whether the promise held once the person landed.
Strong CTR with weak add to cart is not a creative problem at all. The ad did its job and delivered a qualified person to the page. What broke happened after the click.
Usually it is congruence. The ad promised one thing and the landing page led with something else. Sometimes it is price, revealed for the first time on the page. Either way, briefing new creative here is the wrong response and it is the response most teams reach for.
5. CPA
What it is: spend divided by purchases.
What it tells you: whether any of it was worth doing.
CPA is the decision metric and the slowest one. Everything above exists so that you can make good decisions in the days before CPA becomes readable. By the time CPA is conclusive, you have usually already spent the money.
Reading them as a sequence
Each metric maps to a moment, and the first one that falls below your account average is where the ad broke.
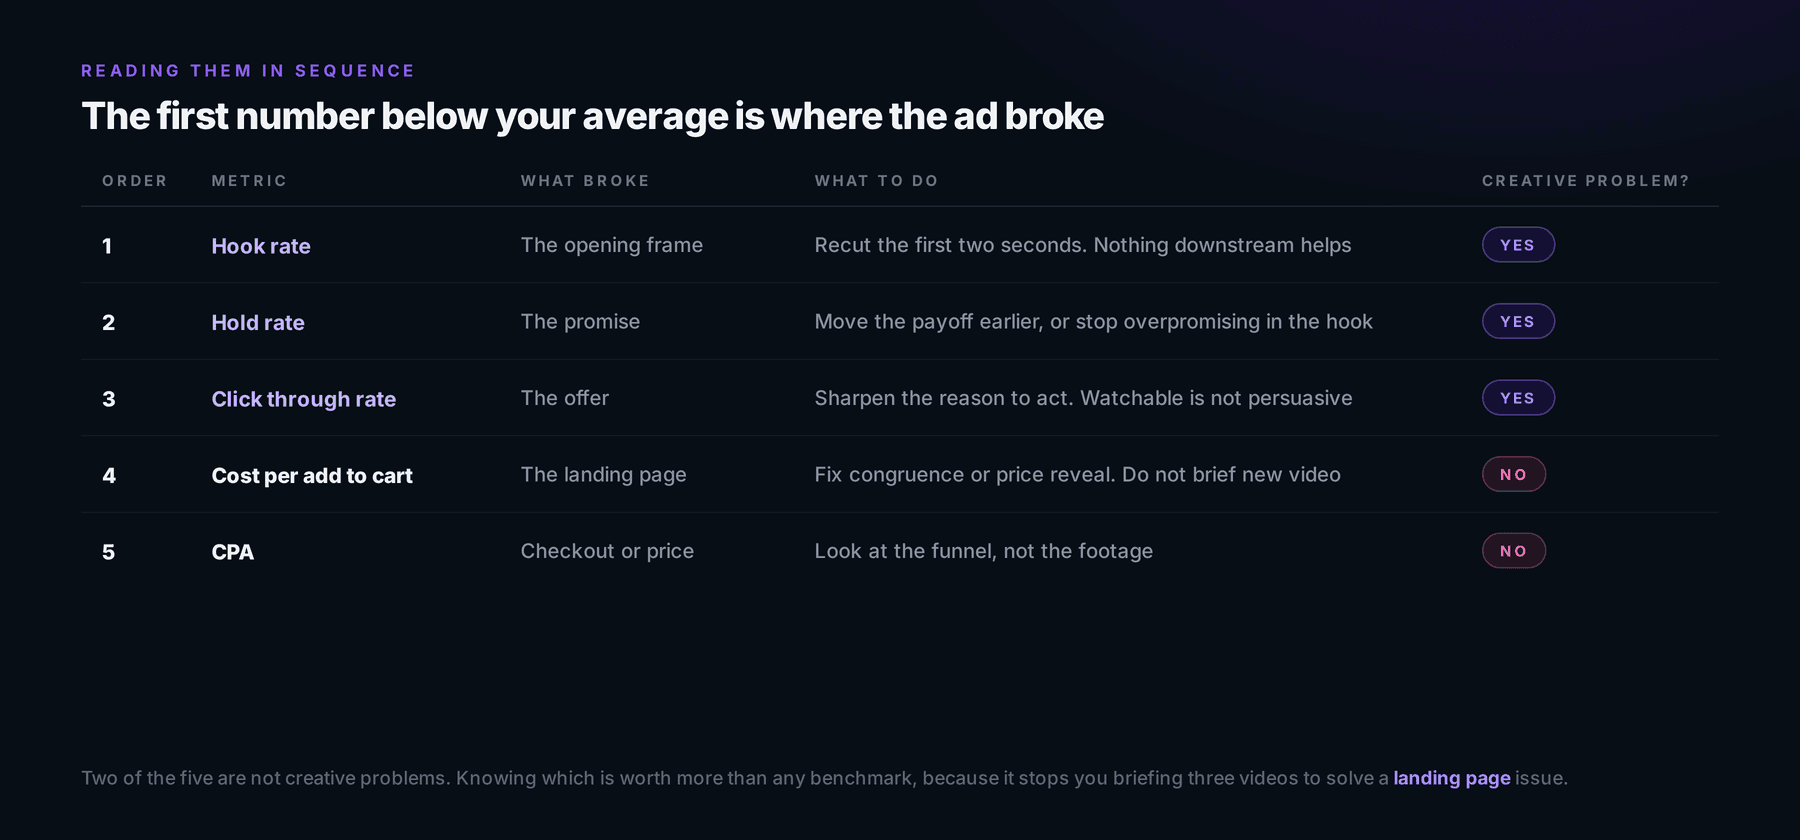
- Hook rate low, everything else unknown. The opening failed. Recut the first two seconds.
- Hook fine, hold low. The promise failed. Move the payoff earlier.
- Hold fine, CTR low. The offer failed. Sharpen the reason to act.
- CTR fine, add to cart low. The page failed. Do not touch the creative.
- Add to cart fine, CPA high. Checkout or price failed. Also not a creative problem.
Two of those five are not creative problems. Recognising that is worth more than any individual benchmark, because it stops you from briefing three new videos to solve a landing page issue.
Use your own averages, not published benchmarks
Public benchmarks are aggregated across categories, price points, and audiences with nothing in common with yours. A 25 percent hold rate might be excellent in one category and poor in another.
The number that matters is your own trailing 90 day average, per placement. Compare every new ad against that. It is the only comparison where the difference means something you can act on.
What good tends to look like across accounts, and what to do when yours sits well outside the range, is in hook rate and hold rate: what good looks like.